
Kin Sells More Policies Than in Any Quarter in Its History as Renewal Business Delivers 50% Margin
CHICAGO, Nov. 10, 2026
Press Release Disclaimer: This is a press release distributed through the XPR Media network. It has not been independently verified by our newsroom.

Kin Sells More Policies Than in Any Quarter in Its History as Renewal Business Delivers 50% Margin
PR Newswire
CHICAGO, Nov. 10, 2026
New policy sales up 53%; Growth Revenue up 47%; Premium in Force reaches $740.5 million
CHICAGO, Nov. 10, 2026 /PRNewswire/ — Kin, the direct-to-consumer provider of insurance and home financing solutions for homeowners, today announced results for the third quarter ended September 30, 2026.
With its renewal business generating a 50% Baseline Adjusted EBITDA Margin, Kin chose to redeploy that organically generated earnings into growth, selling more new policies than in any quarter in its history. Gross Written Premium growth accelerated to 24% year-over-year, up from 15% in the second quarter. New policy sales rose 53%, Growth Revenue grew 47% year-over-year to $19.5 million, up sequentially from $17.9 million in Q2, and Premium in Force3 at Kin’s managed reciprocal exchanges reached $740.5 million, up 22% vs. prior year.
“When new customers become part of a renewal business that earns a 50% margin, the smart move is to add as many good customers as we can,” said Kin Founder and CEO Sean Harper. “That’s exactly what we did this quarter. We sold more policies than ever before. Our model compounds: customers renew, they add auto insurance and home financing, and every policy makes our pricing smarter. Adding more customers also increases the speed at which our algorithms learn and we accumulate data, driving value for both Kin and its customers.”
Third Quarter 2026 Highlights
- Record new policy sales: New policy sales rose 53% year-over-year. New home policy sales rose 32%, with an average premium of $2,303, making Q3 Kin’s strongest quarter on record for new policy sales. New Written Premium4 grew 33% to $65.0 million.
- Revenue from new customers: Growth Revenue6 increased 47% year-over-year to $19.5 million, up 9% from $17.9 million in Q2 2026.
- Scale: Premium in Force3 reached $740.5 million, up 22%. Gross Written Premium¹ increased 24% to $199.9 million, accelerating from 15% growth in Q2 2026, including Renewal Written Premium5 of $134.9 million, up 20%.
- A highly profitable core: Kin Insurance, Inc.² generated $63.7 million in Total Revenue, up 24%. Gross Profit9 rose 25% to $60.1 million at a 94% Gross Margin. Baseline Adjusted EBITDA14 increased 20% to $22.1 million, and Baseline Adjusted EBITDA Margin rose to 50% from 48%.
- Deliberate investment: Growth Expenses10 rose 74% to $44.1 million, resulting in an Adjusted EBITDA13 loss of $3.7 million for the quarter.
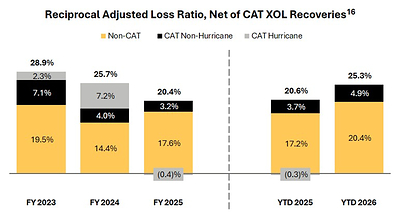
- Efficient risk selection: Kin’s managed reciprocal exchanges recorded no hurricane losses net of reinsurance in Q3, posted a 25.3% adjusted loss ratio16 through September 30, and generated $15.5 million in Combined Carrier Adjusted Net Income15.
|
Year to Date |
Quarter |
|||||
|
($ in millions) |
Q3 2026 |
Q3 2025 |
Q3 2026 |
Q3 2025 |
||
|
Kin Reciprocal Exchanges1 |
||||||
|
Premium in Force3 |
$ 740.5 |
$ 608.2 |
$ 740.5 |
$ 608.2 |
||
|
% Growth (YoY) |
22 % |
31 % |
22 % |
31 % |
||
|
New Written Premium4 |
176.7 |
152.1 |
65.0 |
48.9 |
||
|
Renewal Written Premium5 |
420.3 |
347.4 |
134.9 |
112.1 |
||
|
Gross Written Premium |
$ 597.0 |
$ 499.5 |
$ 199.9 |
$ 161.0 |
||
|
% Growth (YoY) |
20 % |
28 % |
24 % |
30 % |
||
|
Kin Insurance, Inc. (Management Operations Segment)2 |
||||||
|
Growth Revenue6 |
53.1 |
43.2 |
19.5 |
13.3 |
||
|
Baseline Revenue7 |
135.2 |
113.7 |
44.3 |
38.1 |
||
|
Total Revenue |
$ 188.4 |
$ 156.9 |
$ 63.7 |
$ 51.4 |
||
|
% Growth (YoY) |
20 % |
30 % |
24 % |
30 % |
||
|
% of Gross Written Premium |
32 % |
31 % |
32 % |
32 % |
||
|
Cost of Sales8 |
10.0 |
9.7 |
3.6 |
3.2 |
||
|
Gross Profit9 |
$ 178.4 |
$ 147.2 |
$ 60.1 |
$ 48.2 |
||
|
% Gross Margin |
95 % |
94 % |
94 % |
94 % |
||
|
Growth Expense10 |
108.5 |
74.6 |
44.1 |
25.3 |
||
|
G&A Expense11 |
40.3 |
31.3 |
13.8 |
11.0 |
||
|
Technology Expense12 |
17.0 |
19.5 |
5.9 |
6.3 |
||
|
Adjusted EBITDA13 |
$ 12.6 |
$ 21.9 |
$ (3.7) |
$ 5.5 |
||
|
% Operating Income Margin |
7 % |
14 % |
(6) % |
11 % |
||
|
Growth Adjusted EBITDA14 |
$ (58.2) |
$ (34.1) |
$ (25.8) |
$ (12.8) |
||
|
% Growth Adj. EBITDA Margin |
(110 %) |
(79 %) |
(133 %) |
(96 %) |
||
|
Baseline Adjusted EBITDA14 |
$ 70.8 |
$ 55.9 |
$ 22.1 |
$ 18.4 |
||
|
% Baseline Adj. EBITDA Margin |
52 % |
49 % |
50 % |
48 % |
||
Leaning into Growth
In the third quarter, Kin’s baseline business produced $22.1 million in Baseline Adjusted EBITDA on $44.3 million in Baseline Revenue7, a 50% margin, up two percentage points from a year ago. That income funds growth. Kin increased Growth Expenses by 74% and turned that investment into record new-customer volume: New Written Premium rose 33%. When those customers renew (which they do at 91% when offered renewal), they become part of the Baseline business where Kin earned a 50% margin in Q3. Many of those customers will add more products from Kin over time.
Together, these results produced an Adjusted EBITDA loss of $3.7 million for the quarter. Kin makes this tradeoff on purpose: every new customer is added to a renewal base with a 50% margin.
Closed-Loop System Powers Efficiency
Kin is built as a closed-loop insurance system: one connected platform, built and owned by Kin, where selling, pricing, underwriting, service, claims and reinsurance all run on the same data. Every quote, policy and claim feeds back into the models that price the next home insurance policy, improving the system as it grows. Operational attributes that support this include:
- Sell direct. Kin sells directly to homeowners, with no independent agents, so it owns the customer relationship and pays no independent agent commission on new or renewal business, savings that help keep premiums competitive.
- Price every home individually. Kin’s AI, machine learning, and proprietary data models analyze more than a thousand data points on each property. Kin can quote a home accurately after asking only a handful of questions.
- Select risks. Kin uses data to inform which homes the reciprocal exchanges insure and the rates filed with regulators.
- Put people at the center of claims. Technology handles the routine work so Kin’s licensed adjusters and service teams can focus on what matters most: helping customers get back to normal with the speed and accuracy they deserve.
- Learn. Claims and loss experience flow back into underwriting and into the rate filings the exchanges submit to regulators.
The loop compounds. Better claims data leads to more accurate prices. More accurate prices let Kin grow profitably. Growth brings more data. Kin Insurance, Inc. earns management fees from the reciprocal exchanges it manages rather than holding their underwriting risk on its own balance sheet. This capital-light model is why Kin is able to sustain a 90%+ gross margin.
“Most insurers are adding AI on top of systems that were built decades ago for agents and paper,” said Kin Chief Technology Officer Kevin Greene. “We built one system, we own all of it, and every part learns from every other part. That loop is very hard to copy, and it gets stronger every quarter.”
Pricing and Selecting Risk
Kin’s managed reciprocal exchanges recorded no hurricane losses net of reinsurance during the third quarter, which includes the peak of the Atlantic hurricane season. Combined Carrier Adjusted Net Income15 across the two managed reciprocal exchanges totaled $15.5 million for the quarter.
Through September 30, the exchanges’ adjusted loss ratio was 25.3%, compared with 31.3% and 28.3% over the same periods in 2023 and 2024. The 2025 ratio of 20.6% for the same period benefited from $7.3 million in favorable development on prior-year claims.
“A loss ratio only means something in context. Our loss ratio is higher this year because of where we’re growing. In states where reinsurance costs less, a policy can pay out more in claims and still earn the margin we target. So a higher loss ratio there doesn’t mean weaker results,” said Kin Chief Insurance & Compliance Officer Angel Conlin. “We set rates by state, product, and risk characteristics to cover expected claims and the cost of reinsurance, and that analytical rigor helps keep our reciprocal exchanges financially strong.”
Operating Leverage: Revenue Is Growing Faster Than Costs
Kin’s model is designed so that costs grow more slowly than revenue. G&A Expenses11 for the third quarter, excluding $1 million of non-recurring, benefit-related expenses, increased 17% vs. prior year while Total Revenue grew 24%.
The majority of Kin’s business processes use AI, so overhead doesn’t grow as fast as the business. Kin automates work across engineering, finance, underwriting, claims, marketing, operations, and customer support. As Kin adds customers, states, and products, more of each new dollar of revenue reaches the bottom line.
Built for AI Shopping
During the third quarter, Kin became the first home insurer to open its direct quoting platform to AI shopping agents, including Meta’s Muse. In October, Kin added support for WebMCP, an emerging open web standard that lets compatible AI agents interact directly with websites. Homeowners can now go from a prompt to an AI agent to a personalized Kin home insurance quote, ready to purchase, in minutes.
The closed loop makes this possible. Because Kin prices each home using more than a thousand data points, an AI agent needs to ask a homeowner only a handful of questions to return a quote. Many home insurers still don’t offer online quoting, and many sell through intermediaries. As more consumers hand off shopping to AI agents, Kin’s direct model makes it an insurer those AI agents can actually do business with, opening a new and efficient way to acquire customers.
“Homeowners are starting to ask AI agents to shop for insurance for them, and Kin was built to answer,” said Harper. “We sell direct, and our data lets us quote a home with just a few questions. We said Kin will win the AI shopping experience. Muse and WebMCP are the first steps.”
Outlook
Kin serves one customer, the homeowner. That customer tends to have a higher income and stronger credit than the average consumer and needs insurance and home financing year after year.
“We’re heading into 2027 with more customers than ever, a renewal business that earns 50% margins, and a system that gets better with every policy we write,” said Harper. “That combination lets us keep investing in growth with confidence. We’ll keep adding homeowners, offering them more ways to save across insurance, home financing and other home costs, and letting the loop do its work.”
Kin operates in 14 states: Alabama, Arizona, California, Colorado, Florida, Georgia, Louisiana, Mississippi, Missouri, Oklahoma, South Carolina, Tennessee, Texas, and Virginia. Together, these states make up 50% of the Total Addressable Market for home insurance. Known for its positive customer experience, Kin earns a 4.7 out of 5 rating on Google based on more than 9,556 customer reviews, an A+ and 4.88 out of 5 rating with the Better Business Bureau based on 2,270 customer reviews, and an “Excellent” rating of 4.9 out of 5 on Trustpilot.com based on 8,795 customer reviews (as of November 9, 2026).
About Kin
Kin serves homeowners. Providing a growing number of solutions, including home and auto insurance and home financing, Kin makes homeownership simpler, more affordable, and better. The company focuses on supporting underserved homeowners in states with high catastrophic risk with more convenient and affordable home and auto insurance coverage by eliminating the need for independent agents and analyzing more than a thousand data points to provide transparent, accurate pricing. Kin complements this with home financing with Kin-exclusive rates to help homeowners secure a better mortgage rate, refinance, or tap into their equity. Kin’s closed loop insurance system delivers a seamless customer experience, customized options, and fast, high-quality service. To learn more, visit www.kin.com.
|
Footnotes |
|
|
Basis of presentation – Kin manages its business in two segments. Management Operations comprises Kin Insurance, Inc.’s management services for the reciprocal exchanges as attorney-in-fact, Kin Financing’s mortgage origination and distribution business, and commissions on policies placed with third-party carriers. Carrier Operations comprises the two reciprocal exchanges and the captive managed by Kin. Kin currently consolidates the reciprocal exchanges and the captive as variable interest entities (VIEs). The results of the reciprocal exchanges are attributable to policyholders as noncontrolling interests. Management Operations results are presented before intersegment eliminations, so they include management fees from the reciprocal exchanges that are eliminated in Kin’s consolidated GAAP financial statements. Segment information is unaudited. Segment definitions, measures and cost allocations may be refined in future periods. Certain prior-period amounts, including the split between new and renewal business, have been revised to conform to the current methodology. Amounts may not foot due to rounding. |
|
|
1. |
Premium information represents the combined results of the two reciprocal exchanges managed by Kin Insurance, Inc. It includes 100% of the premium written through a fronting arrangement with a third-party carrier, of which the reciprocal exchanges assume 90%. This business is being transitioned to the reciprocal exchanges. |
|
2. |
Represents the Management Operations segment of Kin Insurance, Inc., as described in the Basis of presentation. Segment results are not a substitute for Kin’s consolidated GAAP results. |
|
3. |
Premium in Force is a key operating metric representing the annualized in-force premium for all active policies at Kin’s managed reciprocal exchanges as of the last day of the period. |
|
4. |
New Written Premium is an operating metric representing the gross premium written during the period on policies issued to new policyholders at Kin’s managed reciprocal exchanges, for each policy’s first term. It includes mid-term changes to those policies during the period and is net of cancellations of those policies. |
|
5. |
Renewal Written Premium is an operating metric representing the gross premium written during the period on policies renewed for a subsequent term at Kin’s managed reciprocal exchanges, by policyholders whose prior term was also written by a Kin-managed reciprocal exchange. It includes mid-term changes to those policies during the period and is net of cancellations of those policies. |
|
6. |
Growth Revenue is a non-GAAP measure representing Management Operations segment revenue from management fees earned on New Written Premium at the reciprocal exchanges. |
|
7. |
Baseline Revenue is a non-GAAP measure representing segment revenue from management fees earned on Renewal Written Premium at the reciprocal exchanges, plus revenue from Kin Financing’s mortgage origination and distribution business and all commissions on policies placed with third-party carriers. Growth Revenue and Baseline Revenue together equal Management Operations Total Revenue. |
|
8. |
Cost of Sales is a non-GAAP measure representing customer servicing costs, payment processing, hosting and internal claims labor expenses of the Management Operations segment. |
|
9. |
Gross Profit is a non-GAAP measure representing Management Operations Total Revenue less Cost of Sales. |
|
10. |
Growth Expense is a non-GAAP measure representing the Management Operations segment’s expenses to acquire new customers and policies. It includes sales and marketing expenses (advertising, lead generation, and the compensation of sales personnel), variable data and verification costs incurred to quote and bind new policies. Growth Expense excludes stock-based compensation, depreciation and amortization, and costs included in Cost of Sales. |
|
11. |
G&A Expense is a non-GAAP measure representing the Management Operations segment’s general and administrative expenses not included in Cost of Sales, Growth Expense or Technology Expense. It includes finance, legal, compliance, human resources and executive personnel costs, professional fees, insurance, facilities and other corporate overhead. G&A Expense excludes stock-based compensation, depreciation and amortization, and other non-recurring and non-operating items, which are excluded from Management Operations Adjusted EBITDA as described in Note 13. |
|
12. |
Technology Expense is a non-GAAP measure representing the Management Operations segment’s expenses to develop and maintain Kin’s technology platform. It includes compensation of technology, product and data science personnel, software and third-party technology costs, and data costs not directly tied to customer acquisition. Technology Expense excludes hosting costs, which are included in Cost of Sales, capitalized software development costs, stock-based compensation, and depreciation and amortization, including amortization of capitalized software. |
|
13. |
Management Operations Adjusted EBITDA is the measure management uses to evaluate segment performance. It is Total Revenue less Cost of Sales and Growth, Technology and G&A Expenses. It excludes depreciation, amortization, stock-based compensation, interest, income taxes and other non-recurring and non-operating items. |
|
14. |
Growth Adjusted EBITDA and Baseline Adjusted EBITDA are non-GAAP measures that split Management Operations Adjusted EBITDA between new and existing business. Growth Adjusted EBITDA is Growth Revenue less the Cost of Sales allocated to it, based on its share of revenue, and less Growth Expenses. Baseline Adjusted EBITDA is Growth Revenue less its allocated Cost of Sales and less all Technology and G&A Expenses. The two measures together equal Management Operations Adjusted EBITDA. |
|
15. |
Combined Carrier Adjusted Net Income is a non-GAAP measure representing the combined statutory net income of the two reciprocal exchanges, adjusted for the inclusion of direct subscriber surplus contributions. The reciprocal exchanges are consolidated by Kin as VIEs, and their results are attributable to policyholders as noncontrolling interests, not to Kin Insurance, Inc. shareholders. Figures are unaudited and based on statutory accounting. |
|
16. |
The adjusted loss ratio is a non-GAAP measure defined as loss and loss adjustment expenses, net of catastrophe excess of loss reinsurance recoverables divided by earned premium and the “earned” portion of subscriber surplus contributions during the period and excludes claims management fees paid to the reciprocal exchange’s attorney-in-fact. |

 View original content to download multimedia:https://www.prnewswire.com/news-releases/kin-sells-more-policies-than-in-any-quarter-in-its-history-as-renewal-business-delivers-50-margin-302934448.html
SOURCE Kin Insurance, Inc.

